How I Got Gemini to Write My Weekly Crypto Portfolio Report
Introduction
Every Sunday morning I used to open my Google Sheet, compare this week's numbers against last week's, and try to make sense of what happened. Token A is up 18% — organic or is someone pumping it? Token B's price is flat but gained 400 holders — accumulation or bots? Token C fired a market cap alert on Wednesday — still relevant, or already reversed?
Done properly, this takes 30–40 minutes. By the time I'd worked through every token, read a few Telegram channels, and formed an actual view, most of my Sunday morning was gone.
I decided to automate the part that takes the longest: turning a week of numbers into a coherent, opinionated summary. Gemini now reads the week's data every Friday and emails me a structured analyst note before the weekend starts.
Here's how it works.
What the Weekly Digest Delivers
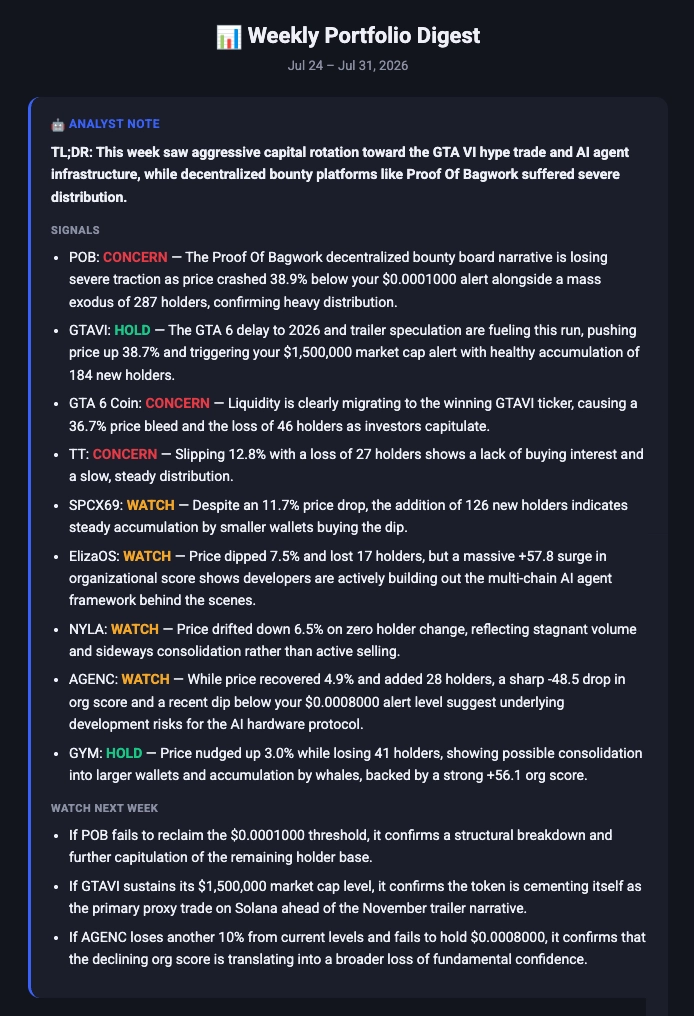
Every Friday in the afternoon, the tracker sends an HTML email covering the trailing seven days, in five sections:
Analyst note — a Gemini-written summary with three parts: a one-sentence TL;DR, per-token HOLD / WATCH / CONCERN signals with specific price levels and observations, and two or three "Watch next week" items with concrete thresholds. This replaces my Sunday morning review.
Top gainers and losers — up to three tokens each, ranked by seven-day price performance.
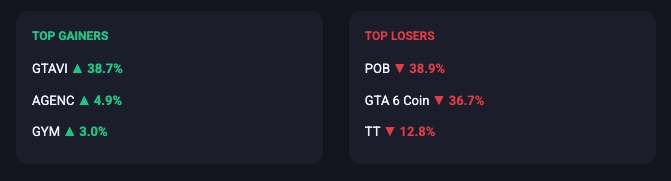
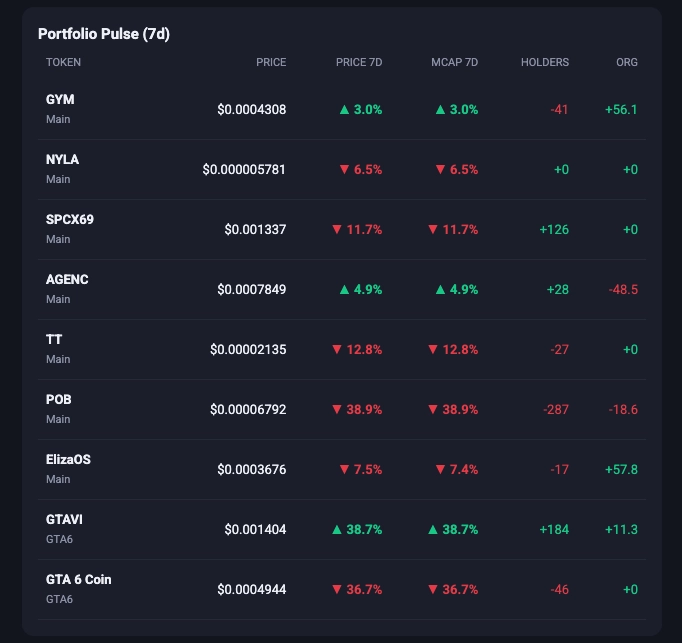
Portfolio pulse table — every tracked token in one place: current price, seven-day price change, seven-day market cap change, holder count delta, and organic score change, with green and red indicators.
Milestones — any token that crossed a holder count milestone during the week (1K, 5K, 10K, 25K, 50K, 100K), so nothing slips by unnoticed.
Alert recap — every price or market cap alert that fired during the week, pulled from the Alert History sheet, completing the week's story in one place.
The Stack Addition
Layer | Technology | Role |
Data | Google Sheets History Log tabs | Seven days of daily snapshots per token |
Compute | Google Apps Script | Reads, aggregates, and formats the weekly data |
AI | Gemini API (gemini-3.1-pro-preview) | Writes the structured analyst note |
Grounding | Google Search (via Gemini API) | Adds real-world news context to the analysis |
Delivery | MailApp (GAS built-in) | Sends the formatted HTML email |
Step One — Reading and Preparing the Data
Before Gemini sees anything, the script does the number-crunching. This matters: Gemini is good at synthesis and language; it's not the right tool for row-by-row arithmetic. The script handles the math, then hands Gemini a clean summary to interpret.
For each tracked token, the script reads every row in the History Log tab and computes:
Price change % — latest snapshot vs. the oldest snapshot from the past seven days
Market cap change % — same approach
Holder count delta — holders gained or lost over the week (absolute, not percentage)
Organic score delta — change in Jupiter's organic score, which measures genuine vs. wash-traded activity
Milestones crossed — whether holder count passed any key threshold (1K, 5K, 10K, 25K, 50K, 100K)
Tokens with less than seven days of history are flagged as "new" with a note that deltas aren't yet meaningful — preventing misleading percentage changes on mid-week additions.
The digest only includes tokens currently present on the dashboard tabs. Remove a token from the portfolio and it drops from the next digest automatically; its history rows stay in the log but don't appear in the output.
Fired alerts from the week are also gathered — pulled from the Alert History sheet and passed to Gemini so it can reference them in context. If a market cap alert fired on a token that subsequently reversed, that's relevant to the analysis.
Step Two — Writing the Prompt
This is where most of the design work happened.
Early prompt versions produced vague analyst-speak that sounded informed but said nothing actionable. "Token A showed positive momentum. Investors should watch for further developments." Useless.
The current prompt does three things that force specificity:
It gives Gemini a persona and a constraint. The model is told it is a crypto portfolio analyst writing for a personal investor, and that it must use the actual numbers and give concrete levels and thresholds — not vague advice.
It requires a fixed output structure. The prompt specifies the exact format Gemini must follow: TL;DR on the first line, a SIGNALS section with one bullet per token formatted as token name followed by HOLD, WATCH, or CONCERN followed by a one-sentence observation, then a WATCH NEXT WEEK section with two or three bullets each containing a concrete threshold or condition. No free-form paragraphs. No markdown.
The HOLD / WATCH / CONCERN call forces a decision. Gemini can't hedge — it must commit to a position for each token. The one-sentence constraint keeps each observation tight and specific.
It asks for divergence analysis. The prompt explicitly tells Gemini to look for divergences — price up with holders down as a possible distribution signal, holders up with price flat as a possible accumulation signal. These are the patterns that take the most time to spot manually.
Here is what the data handed to Gemini looks like for each token — a single plain-text line:
BURGER (Main): price +14.2%, mcap +11.8%, holders +342, org score +1.3
One line per token, plus the list of alerts that fired during the week. Everything else in Gemini's response comes from its own reasoning and, when available, from Google Search.
Step Three — Google Search Grounding
This is what elevates the digest from a numbers summary to something that reads like an analyst note.
With Google Search grounding enabled, Gemini can search the web in real time before generating its response. For a small-cap Solana token, that might mean a project announcement, a community post about a partnership, a new listing, or a news article. Gemini can then weave that context into the analysis.
If a token had a strong week and Gemini finds a relevant announcement, the SIGNALS bullet can reference the actual event rather than speculate. That changes "price up, possibly due to speculation" to "price up following [specific news], watch whether momentum holds into next week."
If the grounded call fails — Gemini's search grounding is occasionally unavailable — the script retries without search enabled. The digest sends either way; you get the numbers-only analyst note instead of the grounded one.
Step Four — Handling a Thinking Model
Gemini 3.1 Pro Preview is a reasoning model — it works through the problem internally before writing its visible response. That internal reasoning consumes output tokens, so if the token budget is too tight, the model runs out mid-sentence and the visible response gets cut off.
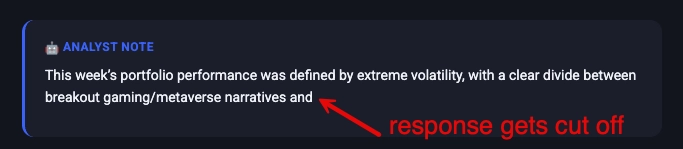
Two settings prevent this:
A generous output token limit. Set to 4,000 tokens — far more than the analyst note needs — giving the model room to reason without crowding out the visible response.
A capped thinking budget. Internal reasoning is capped at 1,024 tokens. Without this cap, the model can burn thousands of tokens on internal reasoning before writing a single visible word — wasteful and risks truncation. Capping it keeps reasoning concise while leaving ample room for actual output.
If the model still hits the token limit — indicated by a specific finish reason in the API response — the script treats the truncated response as a failure and retries with the numbers-only variant. A cut-off analyst note is worse than no analyst note.
Step Five — Rendering the Structured Output
The analyst note arrives from Gemini as plain text with a fixed structure. The script renders it as email-safe HTML — no external stylesheets, no web fonts, all formatting inline, as email clients require.
The rendering logic scans the plain text line by line:
A line starting with TL;DR becomes a bold summary paragraph
A line in all-caps ending with a colon becomes a section heading
A line starting with a dash or bullet becomes a list item
The HOLD, WATCH, and CONCERN keywords are colour-coded: HOLD in green, WATCH in amber, CONCERN in red. You can scan the email in seconds and immediately see which tokens need attention.
The rendering is purely mechanical — it formats, it doesn't interpret. No AI involvement.
Graceful Degradation — Three Failure Modes Handled
No Gemini API key. The digest skips the analyst note and sends the numbers-only email. Nothing breaks. The performance table, top movers, milestones, and alert recap all appear normally.
Grounded call fails. The script retries immediately without grounding. The digest still contains an analyst note — without the real-world news context.
Response is truncated. The script discards the cut-off response rather than emailing half a sentence. If both attempts produce truncated responses, the digest sends without an analyst note. The performance table is always present.
In practice, across several months of weekly sends, the grounded call has succeeded the majority of the time. The fallback chain has activated only a handful of times.
What This Looks Like in Practice
A typical SIGNALS section:
That note would take me 20–30 minutes to write manually. It arrives Friday evening and takes 90 seconds to read.
Just Use Replit
The Replit AI pair programming environment handled the hardest parts of this feature: prompt engineering and thinking model configuration.
Getting the prompt to produce consistently structured, opinionated output took several iterations. Replit made it easy to edit the prompt, push, trigger a manual digest send, and evaluate the result. That tight feedback loop — edit, push, test, evaluate — made rapid prompt iteration practical.
The thinking model token budget is also non-obvious. The interaction between thinkingBudget and maxOutputTokens is the kind of thing that takes hours to debug from first principles. An AI pair that understood the Gemini API internals cut that time significantly.
More broadly, this feature shows what the Replit + Apps Script workflow does well: connecting multiple external APIs with no infrastructure. The digest calls Jupiter for data, Gemini for analysis, and Google's mail service for delivery — no server, no deployment pipeline, no monthly bill.
Who This Is For
Solana investors tracking 5–30 positions who spend weekend mornings manually reviewing charts and forming a weekly view
Anyone who finds AI-generated content too generic — the structured prompt and mandatory HOLD / WATCH / CONCERN calls produce output closer to an analyst template than a paragraph of filler
Developer-curious traders who want to wire a real AI API call into a practical tool without building a web app or managing infrastructure
Makers who've dismissed AI for financial use cases — the key insight: AI handles language and synthesis, not arithmetic. The numbers come from the sheet. Gemini interprets them.